You are reviewing real-time Measurement While Drilling (MWD) survey logs and mud logging data for a 1,200-metre horizontal section in the Central North Sea. Frequent slide steering corrections have dropped the instantaneous rate of penetration (ROP) from 25 metres per hour down to 8 metres per hour. With UK Continental Shelf (UKCS) rig spread rates currently exceeding £150,000 per day, unoptimized trajectory changes instantly inflate lateral drilling cost per meter far beyond the Authorization for Expenditure (AFE) baseline.
Evaluating drilling cost per meter in real time gives operating asset teams the financial clarity needed to justify trajectory adjustments. By linking positional steering choices directly to section unit economics, drillers and geosteerers can prevent costly steering cycles, avoid out-of-zone excursions, and protect ultimate well productivity.
Defining Drilling Cost per Meter Beyond Simple ROP Metrics
According to data cited in the NSTA Overview and recent reporting on how Reinstated wells produced 16 million boe in 2025 by the North Sea Transition Authority (NSTA), average UKCS drilling costs reached £10,000 per metre in 2025, representing a minor reduction from £10,135 per metre in 2024. Despite these high expenditures, a common industry misconception persists that drilling cost per meter is governed solely by ROP and drill bit longevity. This narrow focus ignores the financial penalty of slide steering, bit wear induced by orientation off-bottom, and section tortuosity.
When directional drillers rely on traditional offline survey calculations using manual tie-in stations, they remain unaware of subtle trajectory drift until multiple pipe stands have already been drilled off-target. Correcting a major trajectory error requires long, continuous orientation slides that reduce mechanical energy transfer to the bit and dramatically slow forward advancement. While traditional manual survey tie-ins delay position calculations, real-time trajectory and survey processing including tie-in and minimum curvature provides immediate wellbore positional updates at every survey station.
Relying strictly on historical surface measurements causes asset teams to miss the structural inflection points within complex reservoir formations. Every unrecorded directional deviation increases the total mechanical energy needed to rotate the drill string, elevating torque and drag for subsequent drilling stands. To lower unit drilling expenses, operating teams must expand the definition of cost per meter to account for active steering efficiency, non-productive time (NPT), and hole quality.
Mathematical Framework and Worked Example for Lateral Sections
Calculating drilling cost per meter across lateral intervals requires a standard financial formula that accounts for rig rates, execution time, and capital equipment expenditures. Technical frameworks published in Drilling Cost Analysis and Estimation and SPE/IADC 52832 Planning an Effective Aerated Drilling Operation express the operational drilling cost per meter as:
In this expression, represents the drilling cost per metre (£/m), is the fully burdened rig spread rate (£/hr), is the active rotating or drilling time in hours, is the tripping time in hours, is the cumulative non-productive or directional orientation delay time in hours, is the capital and rental expense for the bottomhole assembly (BHA) including drill bits and directional tools (£), and is the total drilled interval length in metres.
Consider a operational scenario involving a 1,200-metre lateral section drilled offshore. The operation carries a rig spread rate of £6,250 per hour, which equals £150,000 per day, and a total BHA expense of £80,000.
In an unoptimized run burdened by frequent slide corrections, the section requires hours of active drilling due to reduced sliding ROP, hours of tripping time, and hours of re-orientation NPT to correct trajectory drift. This results in a total operational time of 92 hours. The calculated total interval expenditure is:
Dividing this figure by the 1,200-metre lateral length yields a baseline drilling cost per meter:
By optimizing directional adjustments to maintain continuous rotary drilling, the asset team increases the average active ROP to 22 metres per hour. This reduces active drilling time to 54.5 hours. Slide-related delays are reduced to hours, and tripping time is eliminated within the active interval evaluation window ( hours). The updated total operational time drops to 56.5 hours. The total interval expenditure becomes:
Dividing this optimized cost by the 1,200-metre lateral length lowers the final unit operational cost:
Optimizing directional corrections reduces section execution costs by £221,875, achieving a 33.8% reduction in drilling cost per meter while preserving identical section length. Additional cost calculation methodologies detailed in Drilling Cost Calculation per Foot demonstrate that similar savings apply across varying lateral lengths when continuous rotation is maintained.
Where the Cost per Meter Metric Can Mislead Asset Teams
Chasing a low drilling cost per meter by pushing high ROP through soft, non-reservoir shale formations reduces instantaneous section unit costs, but it frequently sacrifices net pay and long-term well productivity. Soft shales allow high drilling speeds that drop short-term cost per meter calculations. However, steering outside the reservoir sand body results in zero productive net pay, requiring subsequent backreaming or sidetracking operations that eliminate any initial cost savings.
Exceeding dogleg severity (DLS) thresholds to quickly rejoin a target formation creates micro-tortuosity along the wellbore trajectory. While sharp steering corrections can return the bit to target boundaries quickly, the localized high doglegs create high friction points along the drill string. High micro-tortuosity increases casing drag during completion operations, often leading to stuck pipe events that cost upwards of £500,000 in dedicated NPT and remediation equipment.
Research documented in Increased Drilling Efficiency of Gas-Storage Wells Proven demonstrates that while low unit costs down to $41.5 per meter are achievable in optimized geological models, field success requires balancing pure mechanical performance with hole quality. Pushing bit weight and flow rates to lower unit costs without monitoring wellbore cleanout can lead to heavy cuttings beds in lateral sections, resulting in packed-off assemblies, lost circulation, and premature bit destruction.
Applying Real-Time Trajectory Adjustments to Preserve Net Pay
Directional steering protocols that integrate continuous apparent-to-true dip conversions prevent unnecessary steering cycles in dipping reservoir formations. By monitoring real-time formation dip changes directly from logging-while-drilling (LWD) images, geosteering teams can adjust wellbore inclination prior to exiting the reservoir boundary. This proactive steering approach eliminates reactive slide corrections, enabling the drill string to stay in rotary mode for a higher percentage of the interval.
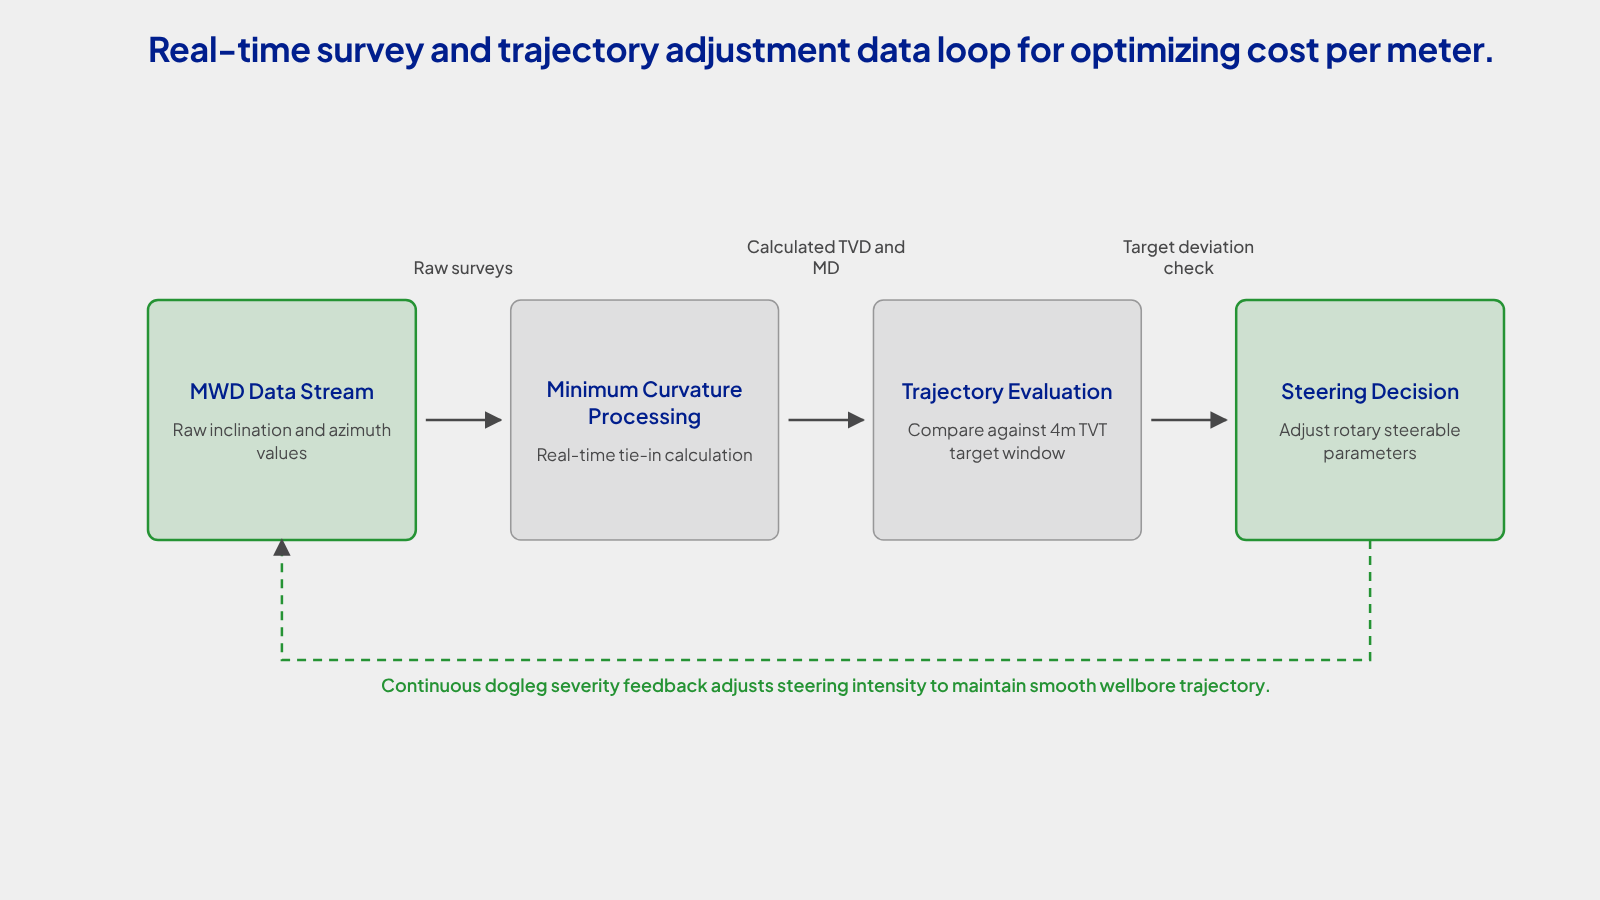
Figure 2. Real-time survey and trajectory adjustment data loop for optimizing cost per meter.
Minimizing directional orientation slides reduces micro-doglegs, keeping drilling cost per meter within 5% of AFE targets while maximizing total reservoir exposure. Smooth wellbores reduce sliding friction, allow higher weight transfer to the bit, and maintain stable bottomhole pressures. Continuous rotation also improves cuttings transport out of the lateral, preventing hole packing and torque spikes during pipe connections.
Geotechnical and operational depth-dependent estimates documented by Tidal Petroleum Drilling Cost show baseline drilling costs ranging from 600 per meter in shallow onshore wells to over £10,000 per meter in complex deepwater offshore environments. Managing trajectory in real time allows asset teams operating across any environment to control unit economics without compromising well integrity.
How is drilling cost per meter calculated for a horizontal well section?
Drilling cost per meter is calculated by dividing total financial expenditures incurred during the section by the total length in meters drilled. The numerator includes hourly rig spread rates, active rotating time, tripping time, directional re-orientation NPT, and fixed BHA rental equipment expenses. The denominator is the total measured depth interval drilled during the operational run.
What factors cause drilling cost per meter to spike during directional drilling?
Major factors that cause unit drilling costs to spike include excessive slide steering, high non-productive time spent re-orienting the bit, tool failures, and borehole instability. Additionally, micro-tortuosity created by aggressive steering increases torque and drag, which reduces penetration rates and increases the risk of stuck pipe events.
Why can a low drilling cost per meter be misleading for asset managers?
A low drilling cost per meter can be misleading if it is achieved by drilling rapidly outside the target reservoir formation. Drilling high-speed shale sections lowers short-term unit costs but yields zero net pay and reduces long-term hydrocarbon recovery. Furthermore, rapid drilling that induces high dogleg severity creates structural hole problems that severely complicate casing installation.
What is the average drilling cost per meter in North Sea operations?
According to reporting published by the North Sea Transition Authority, average offshore drilling costs in the UK Continental Shelf were approximately £10,000 per metre in 2025. This figure represents a slight reduction from £10,135 per metre recorded in 2024, reflecting operational adjustments made across deep offshore development wells.
On your next horizontal well section, evaluate drilling cost per meter alongside net pay exposure and tortuosity metrics, ensuring directional decisions balance instantaneous ROP with total hole quality.
References
- 1.Increased Drilling Efficiency of Gas-Storage Wells Proven · onepetro.org
- 2.SPE/IADC 52832 Planning an Effective Aerated Drilling Operation · onepetro.org
- 3.Drilling Cost Calculation per Foot | PDF · pt.scribd.com
- 4.Drilling Cost | Tidal Petroleum · tidalpetroleum.com
- 5.Drilling Cost Analysis and Estimation | PDF | Drilling Rig | Pressure · scribd.com
- 6.Reinstated wells produced 16 million boe in 2025 · nstauthority.co.uk
- 7.NSTA Overview · nstauthority.co.uk